1,200+
practices in the benchmark
Find out what you should be getting paid.
You know what your payers pay you. You have no way to know whether that’s good. We do — because we process $2B in claims a year across 1,200 practices.
 HIPAA · ONC · PCI certified
Benchmarked against 1,200+ independent rehab therapy practices.
Why this matters
A health system negotiates therapy rates as a rounding error inside a much larger contract. You negotiate them alone, every few years, with no comparison data and no leverage. This is the leverage, and it’s the clearest single thing you get from being on a platform with 1,200 other independent practices. It is also the one claim in this category that cannot be replicated by writing better software — it requires scale that takes decades to accumulate.
Is my data shared?
Benchmarks are aggregated and de-identified. No practice sees another’s claims, contracts, or patients.
Can I use this in a real negotiation?
That’s what it’s for — renegotiation documentation you can put in front of a payer rep.
Payer intelligence built on $2B in annual claims across 1,200 independent rehab therapy practices.
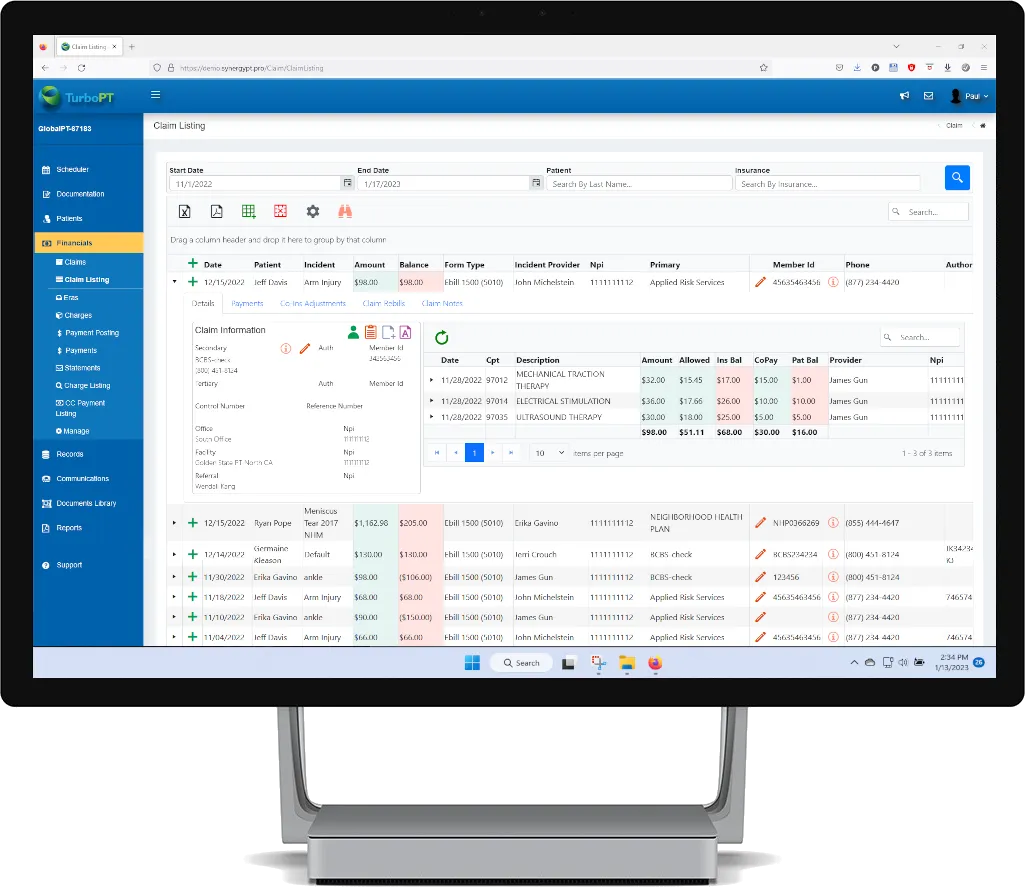
Your net reimbursement per unit, by code and payer, against comparable practices.
Every payment reconciled against your actual contracted rate.
Your payer contracts ranked by what they’re costing you.
What a workers’ comp patient is worth versus a Medicare post-surgical referral versus direct-access cash, per treatment hour.
Output you can put in front of a payer rep.
Key performance stats
practices in the benchmark
in claims annually
of mid-sized practices negotiate with poor-paying insurers — almost none with comparison data
What practices ask before putting benchmark data in front of a payer.
Benchmarks are aggregated and de-identified. No practice sees another’s claims, contracts, or patients.
That’s what it’s for.
A 30-minute walkthrough showing where your payers underpay against 1,200+ comparable practices.